- The original Wilder's ATR plus 11 other variations of Average Range or Average True Range
- Any period length on each variation
- Charts (scales update automatically)
- Fast and simple – enter data and click a button (and change parameters if you want)

- Intuitive navigation – you can start using it immediately
- User guide explaining all the calculation methods
- Works in all versions of Excel from Excel 97 to the latest, including Excel for Mac
$39 one-time payment
Instant download
You can find more details about individual features, exact contents of the user guide, and screenshots below:
Supported Indicators and Calculation Methods
The calculator can calculate 12 different variations of Average Range or Average True Range:
Four Types of Range
- Range = high less low
- True Range = the greatest of high less low, high less previous close, and previous close less low
- % Range = Range divided by previous close
- % True Range = True Range divided by previous close
Three Averaging Methods
- Simple moving average
- Exponential moving average: a = 2/(n+1)
- Wilder's smoothing method: a = 1/n
Note: The original ATR as introduced by J. Welles Wilder Jr. is True Range + Wilder's method.
You can set any period length on any of the variations.
All the calculation methods are explained in chapter 4 of the user guide.
ATR Calculator User Guide
The user guide provides detailed instructions and notes for using the calculator and explains the differences between individual calculation methods. You can find an overview of the contents below:
- Introduction ...3
- Structure and Basic Guidelines ...4
- Entering Market Data ...5
- Calculations and Parameters ...12
- Charts ...18
- Macro-Free Version ...20
- Common Technical Problems ...22
- Contact, Disclosures, and Disclaimer ...24
$39 one-time payment
Instant download
Screenshots – This is How the Calculator Looks:
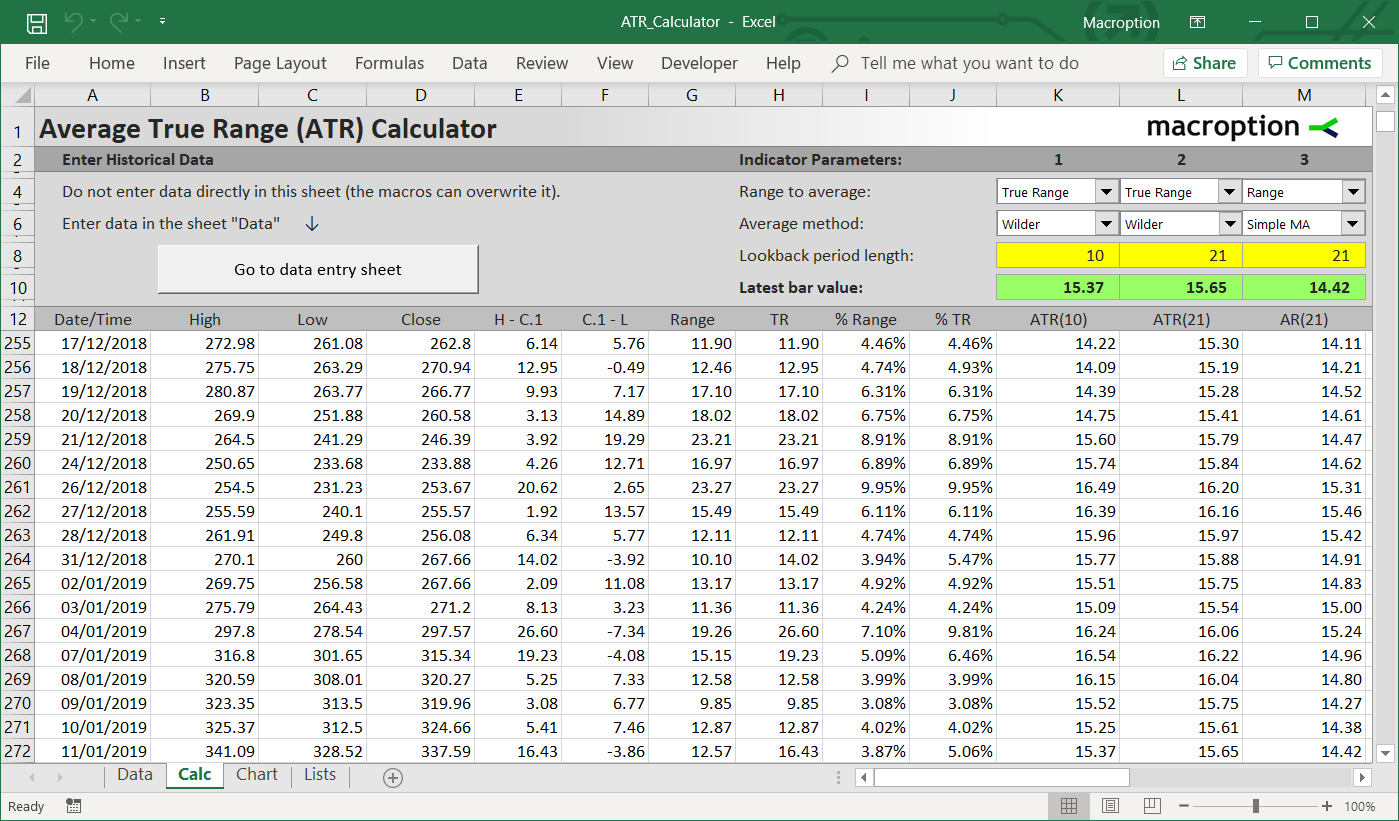
The main calculation sheet:

You can calculate up to three different indicators at the same time (columns K-M).
Here you can set parameters for the indicators:

You can choose from four types of range (Range, True Range, % Range, and % True Range) and
three averaging methods (simple moving average, exponential moving average, and the original Wilder's smoothing). You can set any period length in the yellow cells (K8-M8).
The chart sheet displays two charts: the upper chart with price and the lower chart with the indicators.

Here you can set which of the indicators to display:

Chart scales are adjusted automatically by a macro.
This is the sheet where you can enter data:

Clicking the button on the right will sort the data from oldest to newest, import it into the calculation sheet, and build indicator formulas. The macro will also check your data for any errors, such as missing prices or non-numeric cells.
Excel Versions and Macros
The default version of the calculator uses Excel macros to make it convenient and easy to use. If you can't or don't want to use macros, there is also a macro-free version available.
All Excel Versions:
- ATR_Calculator.xlsm = default version (all features, easiest to use)
- ATR_Macro-Free.xlsx = macro-free version (if you can't use macros)
- ATR_for_Excel_97-2003.xls = Excel 97-2003 version
- ATR_for_Excel_97-2003_Macro-Free.xls = macro-free Excel 97-2003 version
Every user gets access to all versions plus the user guide in pdf.
$39 one-time payment
Instant download
If you have any questions, please ask me.