This page provides instructions and an example how to price index options in the Binomial Option Pricing Calculator.
On this page:
Entering Inputs
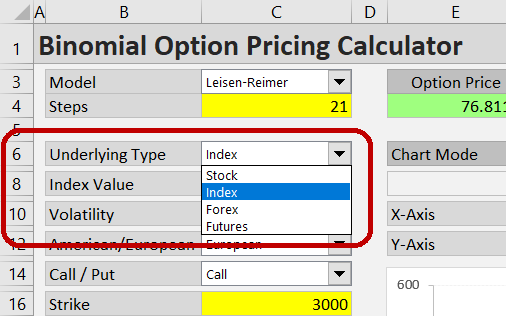
The calculator can work with stock, index, currency or futures options. This is selected in the Underlying Type dropdown box in cell C6. For index options, select "Index".

When "Index" is selected, the label of the input below – underlying price – changes to "Index Value". Enter the current value of the index.
Enter volatility in the next input cell C10 (see more details).
Then you need to select the option type. Choose either American or European. Most US traded stock index options are European type (including SPX or DJX options on the S&P500 and the Dow, respectively), although there are exceptions (such as OEX – S&P100 options). Also choose whether the option is call or put.
Then you need to enter all the other inputs: the option's strike price, time to expiration (you can choose different formats), interest rate and dividend yield. These inputs work the same as with stock options (only difference is that with index options you always enter dividends as continuous yield).
Example
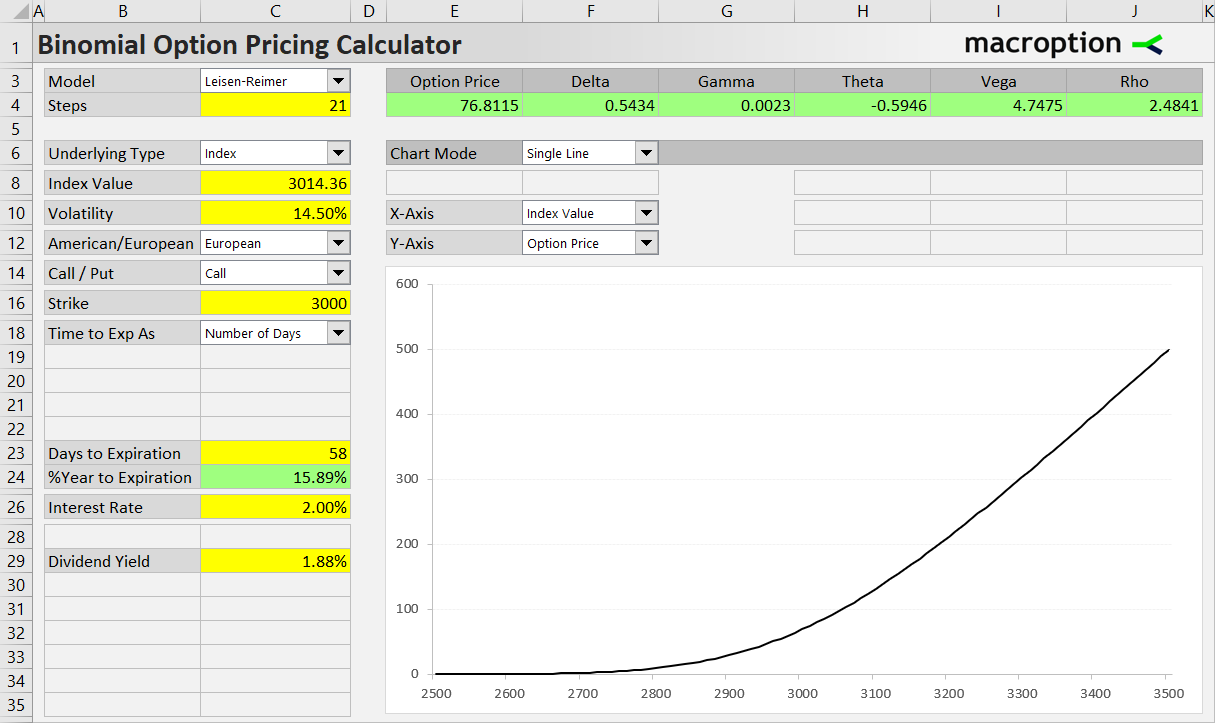
For example, let's price a 3000 strike call option on the S&P500 index (SPX) with 58 days to expiration. Let's say the S&P500 index is at 3014.36, estimated volatility is 14.50%, dividend yield is 1.88% and the risk-free interest rate is 2.00%.
The correct inputs are shown in the screenshot below.

In this case, using the Leisen-Reimer model with 21 steps (cells C3-C4), the resulting option price is $76.81, shown in the green cell E4 above the chart. You can also see the Greeks in the other green cells F4-J4.
In the chart you can model how different inputs affect option price or Greeks. For more details see Working with the Chart.
Other Underlying Types
For instructions and examples of the other underlying types, see: