This page explains how to enter the time to expiration input in the Black-Scholes Calculator either as number of days or as valuation and expiration date and time, and how to set up charts modeling the effects of passing time on option prices and Greeks.
Entering the Time to Expiration Input
For option prices and Greeks to be calculated, you need to enter all six Black-Scholes inputs (the other five are underlying price, strike price, volatility, interest rate, and dividend yield). All are set in the yellow cells in the upper left corner of the main sheet.
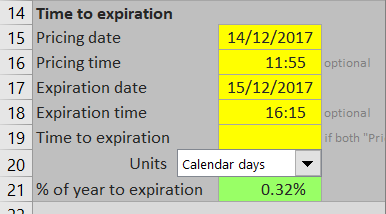
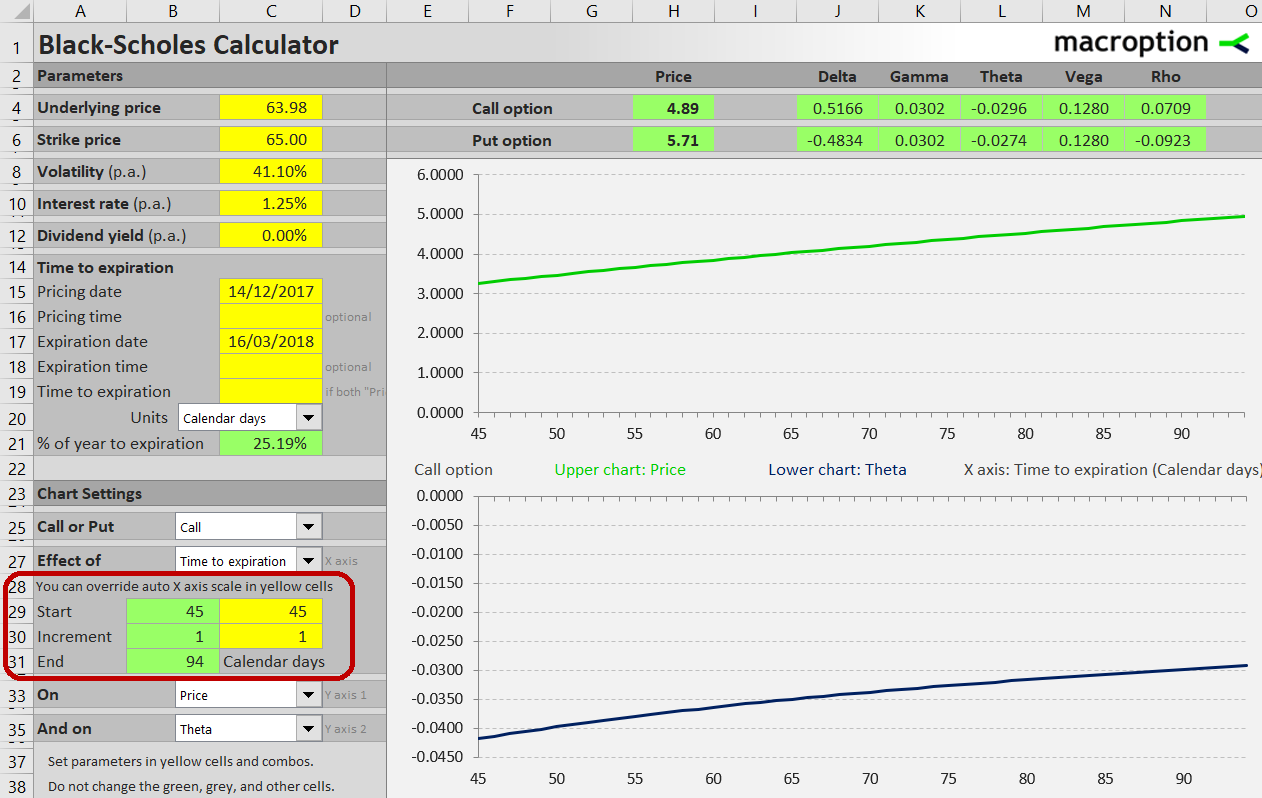
Time to expiration is entered in cells C15-C20, either directly as number of days to expiration or as valuation and expiration dates (and optionally times).
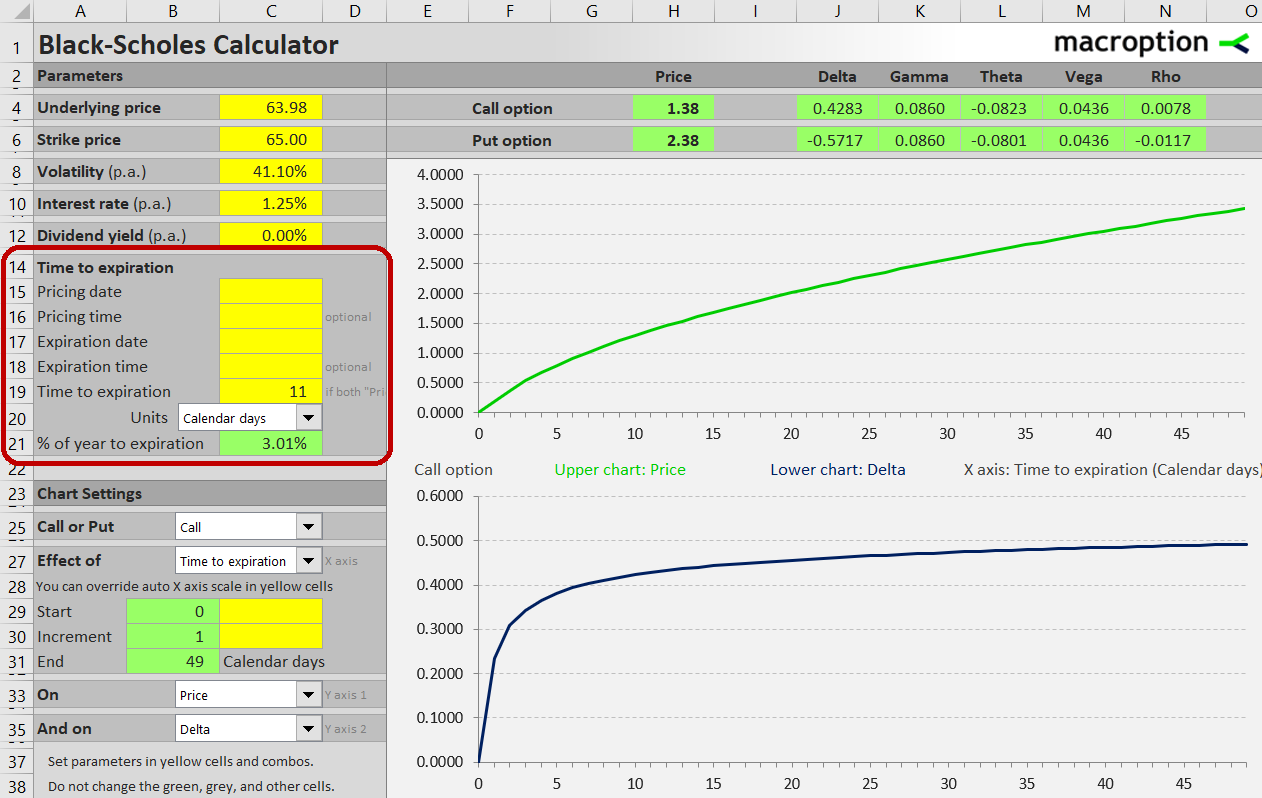
The easiest way is to type the number of days to expiration in cell C19, as shown in the screenshot above. Leave cells C15-C18 blank.
The number that actually enters all the option price calculations is time to expiration as percentage of year, which you can see in the green cell C21. Do not overwrite this cell – it contains a formula (the basic rule to keep in mind for this and all other Macroption calculators: yellow cells are for inputs, green cells are formulas and should not be changed).
Calendar vs. Trading Days
While it is more common to work with calendar days in the Black-Scholes model, some people prefer trading days. The calculator can handle either, plus a number of other time units such as months, weeks, hours, minutes, or seconds. Select the preferred unit in the combo box in cell C20.
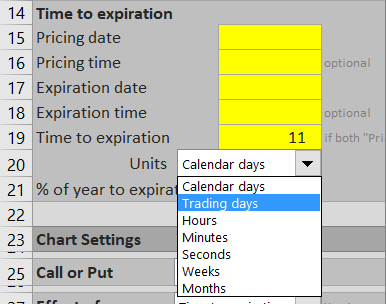
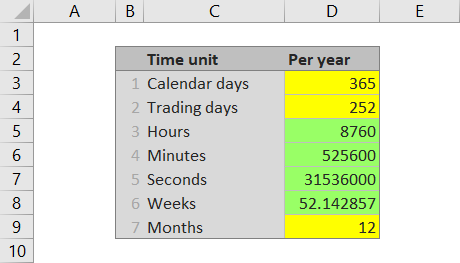
Based on this selection, the number entered in cell C19 is divided by number of the selected units per year to get time to expiration as percentage of year in cell C21. By default, calendar days are divided by 365 and trading days by 252. You can change these settings in the sheet "Time Units", as shown in the screenshot below.
Entering Valuation and Expiration Dates
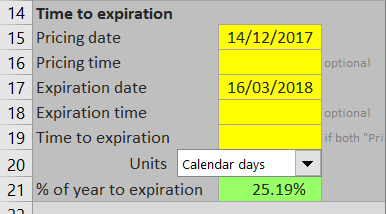
The alternative way to enter time to expiration is by setting pricing date and expiration date in cells C15 and C17, respectively. If both these cells contain values, they override any value entered in cell C19. In other words, if you want to enter time as number of days in cell C19, leave cells C15 and C17 blank.
Intraday Pricing and Fractions of Days
Optionally, you can enter the exact pricing and expiration time in cells C16 and C18 to get more precise result. This is important especially for short-dated options.
Calculated Theta Values
The calculated option prices and Greeks can be found in the green cells H4-N4 for calls and H6-N6 for puts. Theta values are in cells L4 and L6.

Theta measures an option's sensitivity to passing time. Mathematically, it is the derivative of option price with respect to the time to expiration input. Usually it is presented as negative number, which is also the format used in this calculator. The number means by how many dollars the option price will change as time to expiration decreases by one day.
For example, the call option in the screenshot has calculated price $4.89 and theta -0.0296. This means we can expect the option's price to decrease by approximately 3 cents to $4.86 the next day, if the other inputs (such as underlying price and volatility) stay the same.
Your selection of time units in the combo box in cell C20 affects how theta is calculated and interpreted. If trading days are selected, theta is the expected option price change in one trading day. If any other time units are selected, theta is the expected price change in one calendar day.
Time to Expiration and Theta Charts
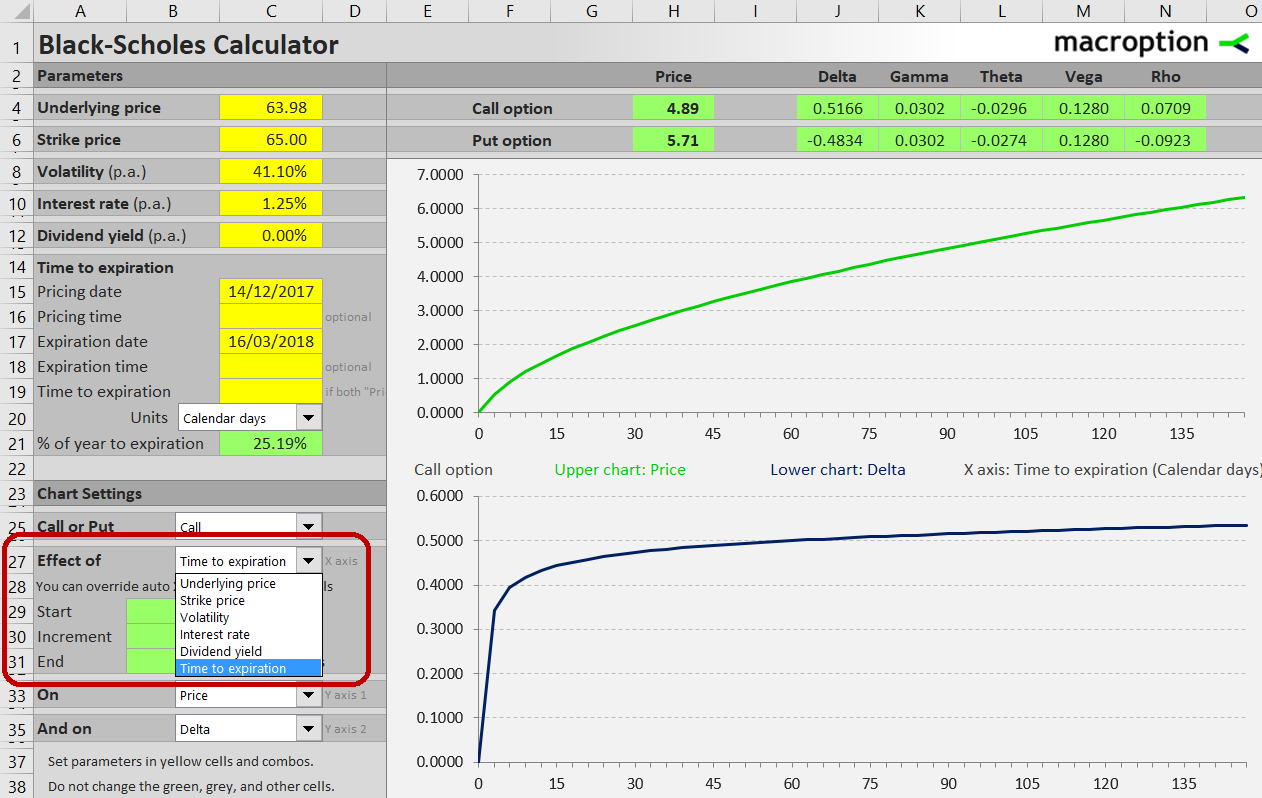
You can use the Black-Scholes Calculator to model the effects of passing time to option prices or the individual Greeks. To display these charts, select "Time to expiration" in the combo box in cell C27.
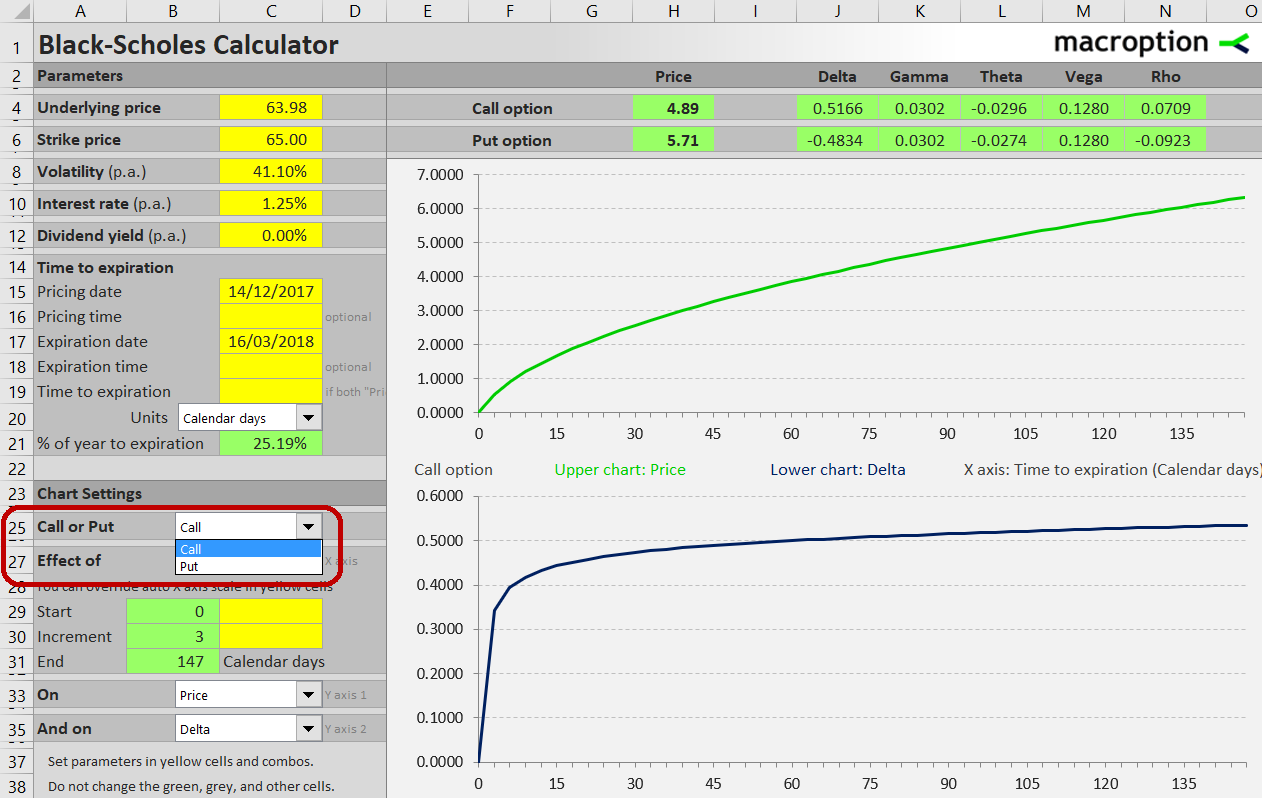
In cell C25, select whether you want the charts for call or put.
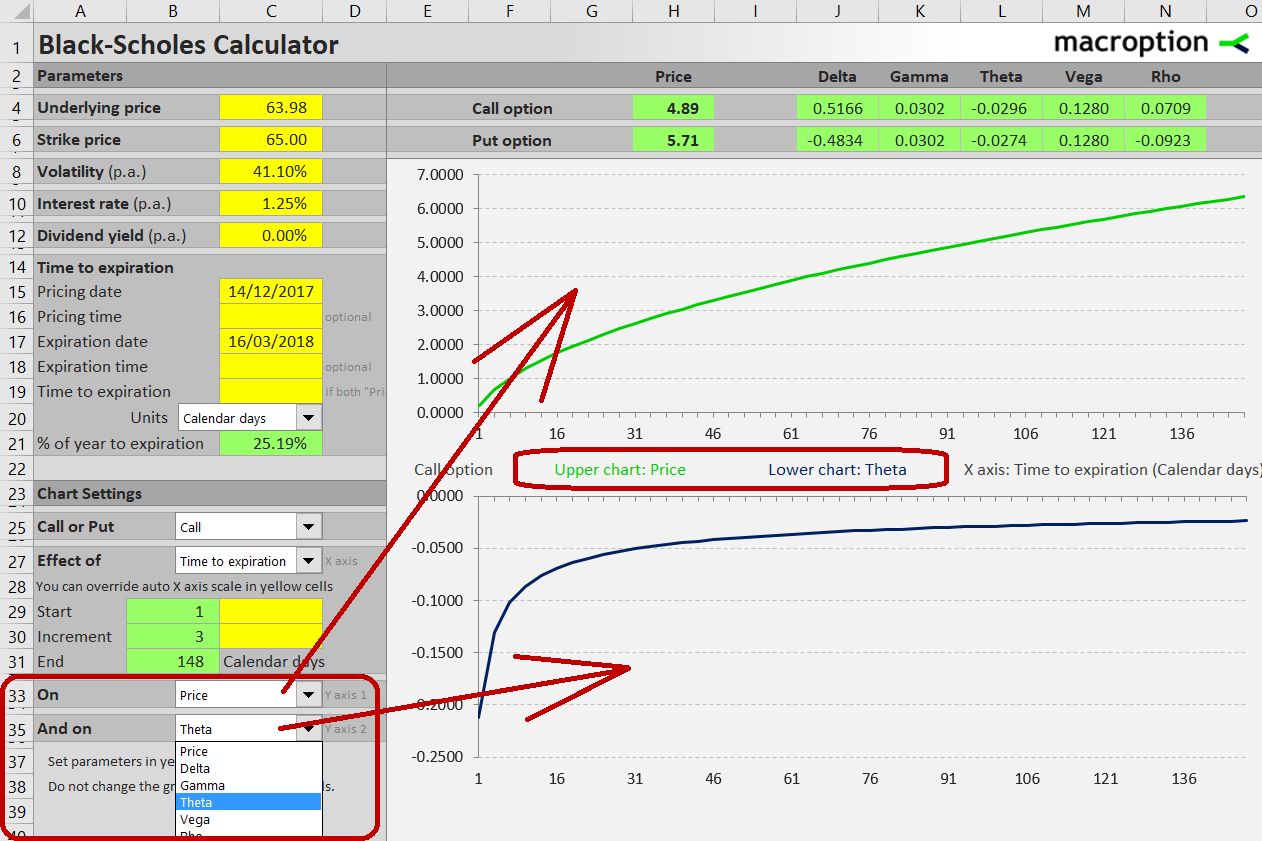
There are two charts, allowing you to model the effects of time to two variables simultaneously. Both charts share the same X-axis. In the combo boxes in cells C33 and C35 select what you want to see on the Y-axes. You can choose option prices or any of the Greeks.
To zoom in to a smaller time to expiration interval, you can override the automatically calculated X-axis range in cells C29 and C30.
More Information
You can find detailed instructions in the calculator's user guide.
You can find an overview of all features and get the calculator here.
If you have any questions, please feel free to ask.