You can easily calculate kurtosis in Excel using the Descriptive Statistics Calculator.
Coefficient of Kurtosis
The coefficient of kurtosis, or simply kurtosis, measures relative frequency of extreme values (on either tail of the distribution.
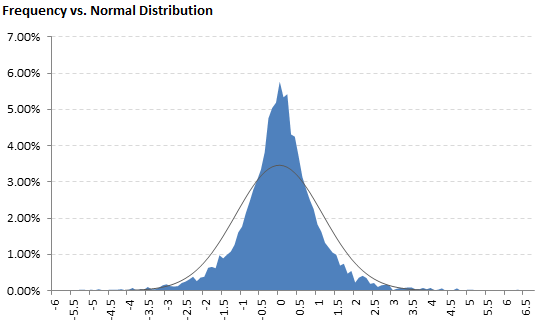
High kurtosis means that extreme values on both the right (high/positive) and the left (low/negative) tail are relatively more frequent (than in a normal distribution with identical mean and standard deviation). It also typically means that the values very close to the mean are relatively more frequent, while the values in between (not too close to the middle, yet not too far on the tails) are relatively less frequent.
If you plot a frequency histogram or another chart showing frequency of such distribution, it would have a sharp peak in the middle and fat tails.

Conversely, low coefficient of kurtosis means that a distribution is less peaked and has thinner tails.
Coefficient of Kurtosis Formula
Coefficient of Kurtosis for a Population

Coefficient of Kurtosis for a Sample

You can see a more detailed explanation of the formulas and their underlying logic here: Kurtosis Formula.
Excess Kurtosis
Kurtosis is often measured and quoted in the form of excess kurtosis, which is kurtosis relative to normal distribution. The coefficient of kurtosis for normal distribution is 3, therefore excess kurtosis equals coefficient of kurtosis less 3.
Calculating Kurtosis in Excel
Here you can see more information about calculating population and sample coefficient of kurtosis and excess kurtosis in Excel.
Here you can get an Excel Calculator of kurtosis, skewness, and other summary statistics.