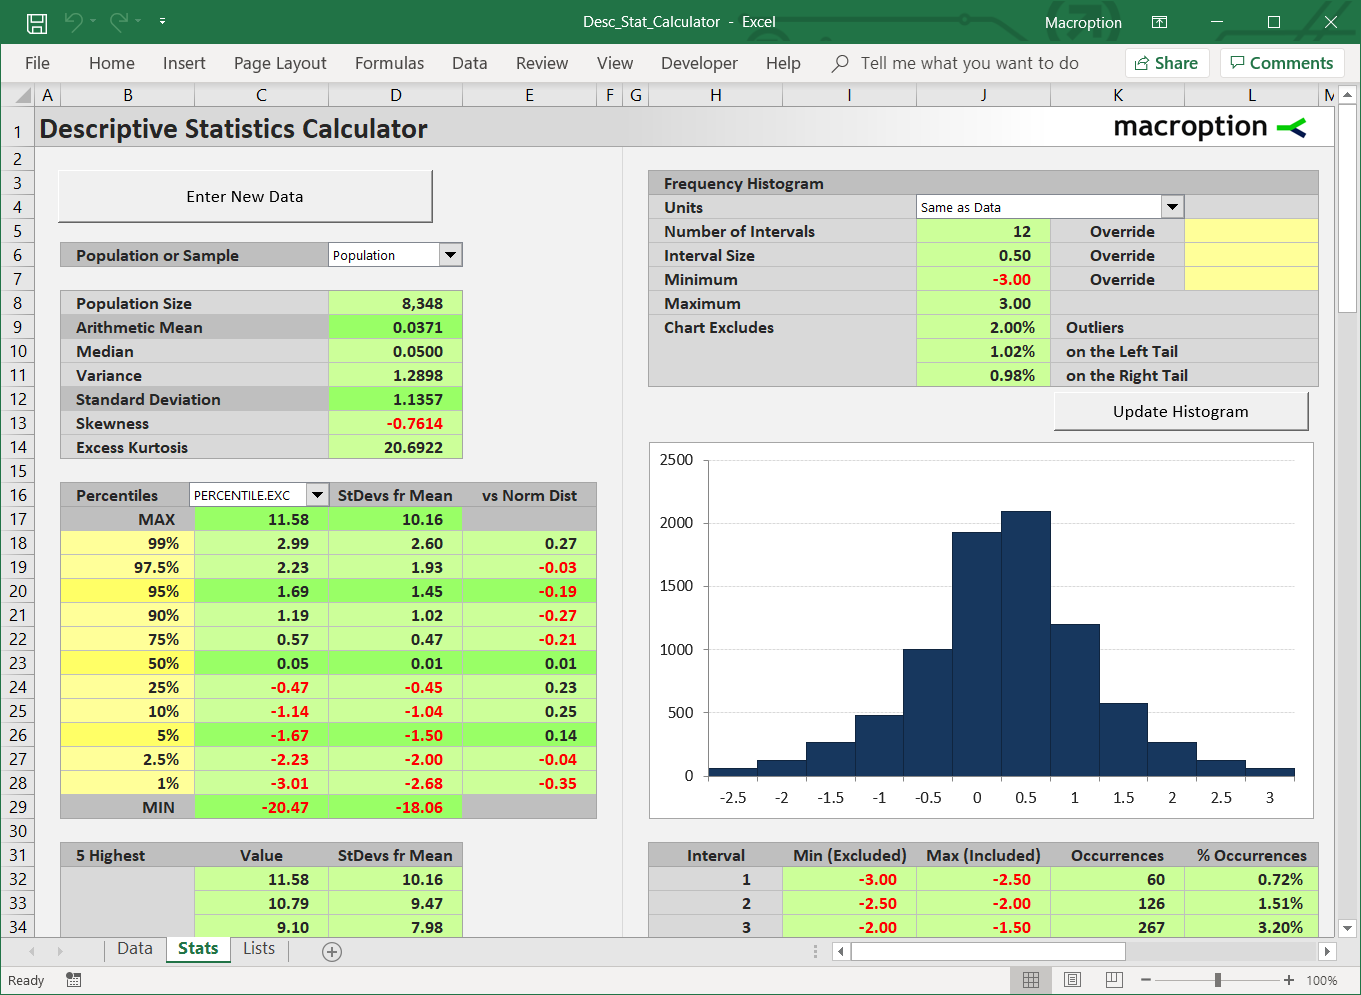
Save time and make sure your calculations are correct.
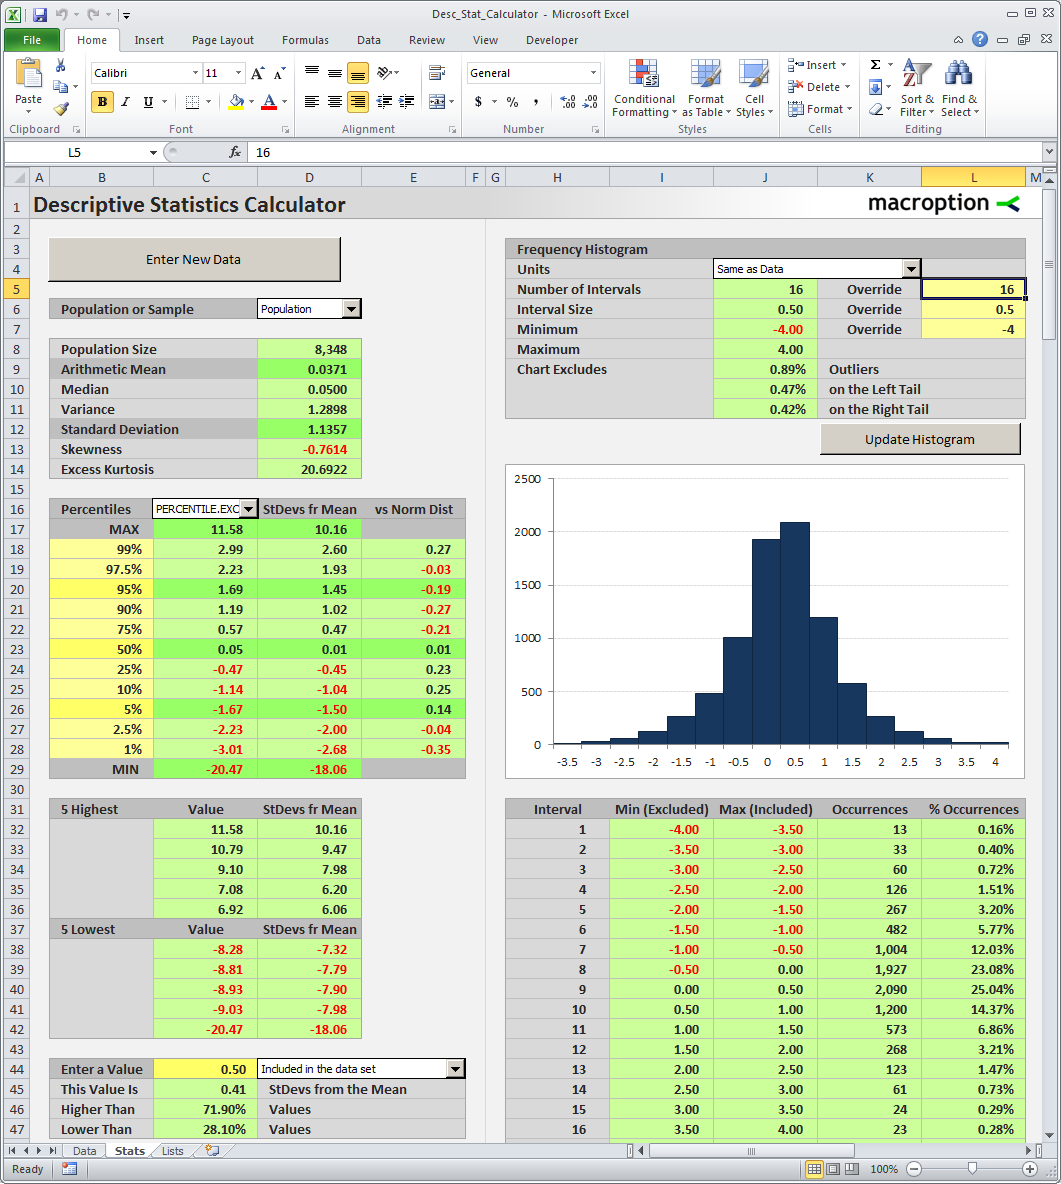
- Mean, median, variance, standard deviation, skewness, kurtosis, percentiles
- Compares your dataset to normal distribution
- Standard score (how many standard deviations from the mean) for any value given
- Frequency histogram and frequency table with a number of intervals you choose

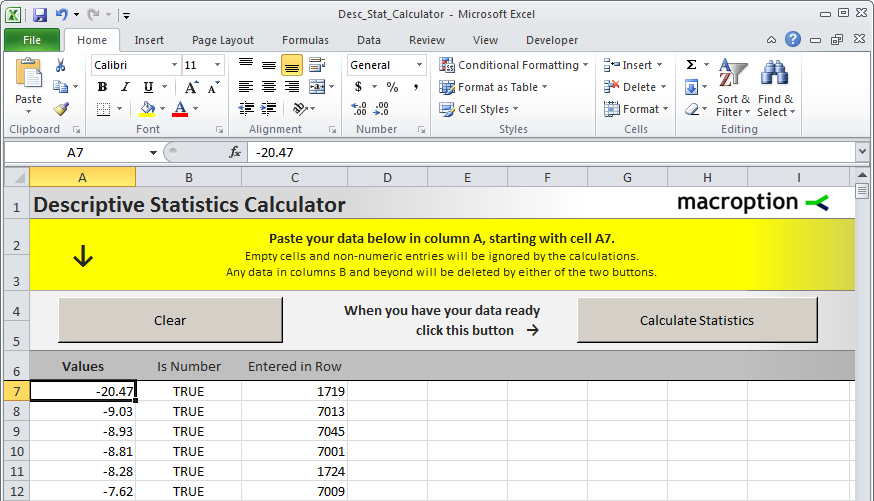
- Fast and simple: paste your data and click a button
- User guide explaining all the calculations
- Works in all versions of Excel from Excel 97 to the latest, including Excel for Mac
$29 one-time payment
Instant download
Screenshots
The main sheet with calculations and histogram:

The sheet where you enter your data. Click the "Calculate Statistics" button and you are done:

The macro automatically checks the data for any errors or formatting issues and displays a message with advice if anything is wrong.
$29 one-time payment
Instant download
User Guide
The Descriptive Statistics Calculator package also includes a user guide, which provides detailed instructions to its use and explains all the calculations and concepts one-by-one.
See overview of contents below:
- Introduction ...3
- Structure and Basic Guidelines ...4
- Entering Data ...5
- Calculations ...10
- Histogram ...23
- Common Technical Problems ...26
- Contact, Disclosures, and Disclaimer ...28
Excel Versions
- Desc_Stat_Calculator.xlsm = default version (for Excel 2010 and newer)
- DSC_for_Excel_97-2007.xls = Excel 97-2007 version
The calculator works in all versions of Excel starting from Excel 97, also including Excel 365 and Excel for Mac.
Due to changes in statistical functions and some other features, users of Excel 2007 and older should use the Excel 97-2007 version of the calculator.
Every user gets access to both versions plus the user guide in pdf.
$29 one-time payment
Instant download
If you have any questions, please ask me.