You can easily calculate excess kurtosis in Excel using the Descriptive Statistics Calculator.
Excess Kurtosis Definition
Excess kurtosis is kurtosis relative to normal distribution. Kurtosis of normal distribution equals 3. Therefore excess kurtosis equals kurtosis less 3.
Excess Kurtosis Interpretation
Excess kurtosis can reach values from -2 to positive infinite.
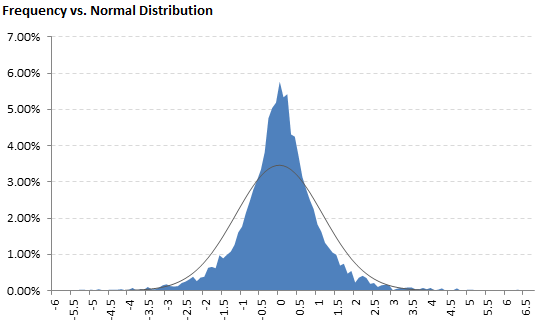
Positive excess kurtosis means that the distribution is more peaked (observations close to the mean are more frequent) and has fatter tails (extreme values are more frequent) than normal distribution. Such distribution is calles leptokurtic or leptokurtotic.

Excess kurtosis of normal distribution is zero. Generally, a distribution that has the same kurtosis as normal distribution (excess kurtosis of zero) is called mesokurtic or mesokurtotic.
Negative excess kurtosis means that the distribution is less peaked and has less frequent extreme values (less fat tails) than normal distribution. Such distribution is called platykurtic or platykurtotic.
Excess Kurtosis Calculation
There is a little difference in calculation of population and sample excess kurtosis. You can see a detailed explanation of the formulas here: Kurtosis Formula.
Population Excess Kurtosis Formula

Sample Excess Kurtosis Formula

Calculating Excess Kurtosis in Excel
In Excel, you can calculate sample excess kurtosis using the KURT function. Population excess kurtosis can be calculated by adjusting the result of KURT (see details how to do it here).
You can easily calculate kurtosis, skewness, standard deviation and other measures using the Descriptive Statistics Excel Calculator.