This page demonstrates how to set up and work with a iron condors in the Option Strategy Payoff Calculator.
Position Setup
The easiest way to create the position is to select "Iron Condor" in the strategy selection dropdown box in cell E6.
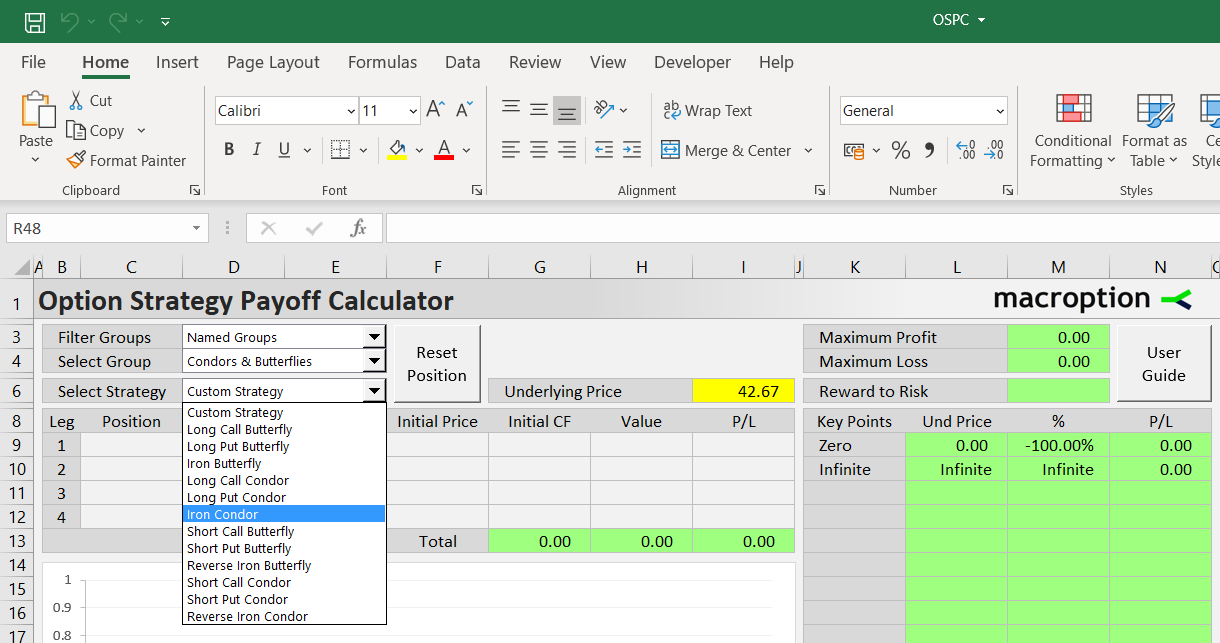
Where to Find Iron Condor
You can find it via any of the following paths in the dropdown boxes in E3 (filter type), E4 (strategy group), and E6 (strategy):
- All Strategies (E3) / All Groups (E4) / Iron Condor (E6)
- Named Groups / Condors & Butterflies / Iron Condor
- Number of Legs / Four Legs / Iron Condor
- Direction & Volatility / Non-Directional / Iron Condor
- Risk Profile / Limited Risk & Limited Profit / Iron Condor
Once selected, the calculator sets the instrument types (call/put) and direction of each leg automatically (you can also build the position manually and set this yourself for each leg). Then you need to adjust strikes, initial option prices, and position size.
Example
Iron condor involves four legs: two puts and two calls, one long and one short of each. Let's model an example position:
- Long 2 contracts of 45 strike put option, bought for 0.78 per share.
- Short 2 contracts of 50 strike put option, sold for 2.21 per share.
- Short 2 contracts of 55 strike put option, sold for 2.32 per share.
- Long 2 contracts of 60 strike put option, bought for 1.01 per share.
We will enter them in the calculator in this order as legs 1-4 in rows 9-12 (but order of legs does not matter for the calculations).
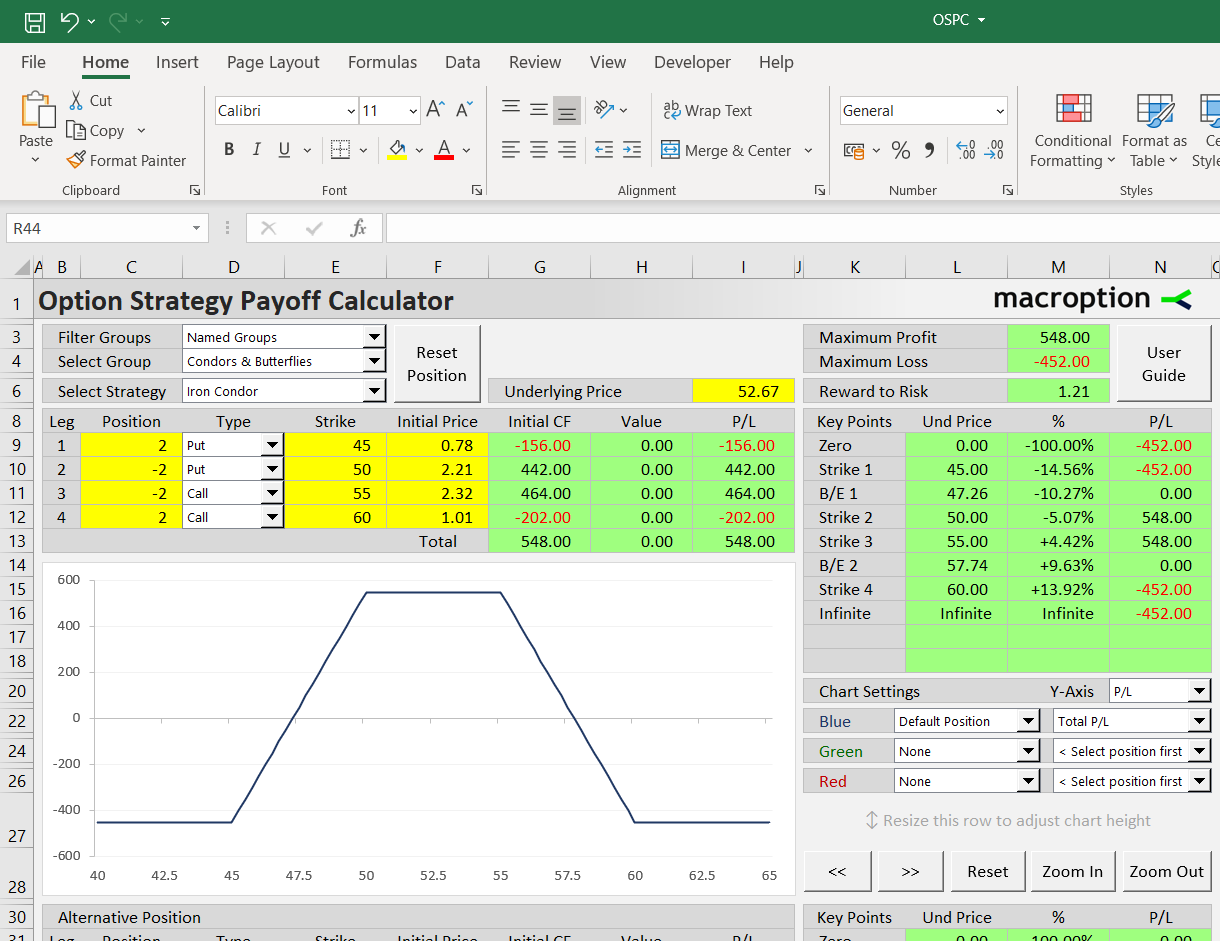
The instrument types in cells D9-D12 are set to Put, Put, Call, Call, respectively.
The position sizes in cells C9-C12 are 2, -2, -2, 2, respectively. Long options have positive sign, short options negative.
The strikes are entered in cells E9-E12: 45, 50, 55, 60.
The last input is initial price for each leg in cells F9-F12. This is the price at which the option was bought (long legs) or sold (short legs) when opening the position. It is per share for one contract, as option prices are normally quoted, and always with positive sign, regardless of direction. In our examples the values should be:
- Cell F9: 0.78 (price paid for the long 45 strike put)
- Cell F10: 2.21 (price received when selling the 50 strike put)
- Cell F11: 2.32 (price received for the 55 strike call)
- Cell F12: 1.01 (price paid for the 60 strike call)
You can enter the prices with or without commissions, depending on your preference. Then the calculator will show P/L and other statistics either with or without commissions.
Value and P/L at Given Underlying Price
Based on the position sizes and initial prices, in the next column G you can see initial cash flow for each leg. For example, for our leg 1 (short 45 strike put), cell G9 shows -156, which is calculated as 0.78 (initial price) x 2 (position size) x -1 (it has opposite sign than position size, as buying options means cash outflow) x 100 (option contract size).
Option contract size is set to 100 by default (as for US stock options), but it is easy to change in the Preferences sheet. You can also change underlying contract size (1 by default), for instance when modeling futures options.
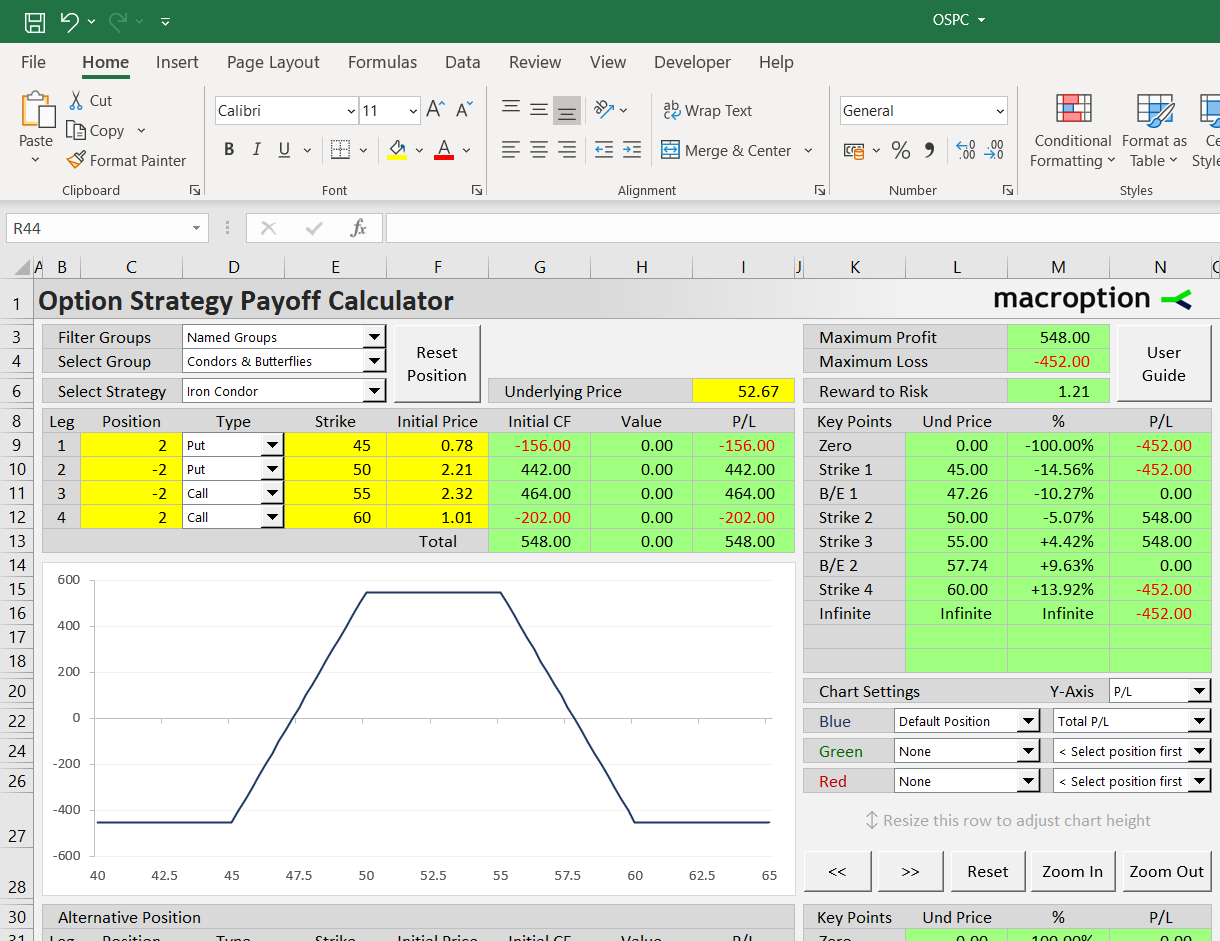
Column H calculates option payoff at expiration, based on underlying price at expiration which you can set in the yellow cell I6 (in our example it is 52.67). The payoff is positive for long in the money options, negative for short in the money options, and zero if the option expires out of the money.
Column I calculates profit or loss as the sum of initial cash flow (column G) and payoff at expiration (column H).
In cells G13-I13, you can see total initial cash flow, payoff at expiration, and profit or loss for the entire position. All are calculated as sum of the four legs.
Risk Profile and Break-Even Points
While the above figures apply when underlying price ends up precisely at 52.67 (cell I6) at expiration, a more complete picture is available on the right in the area K9-N18. It shows profit or loss at all important price points, which include both extremes (zero and infinite), all strikes, and all break-even points.
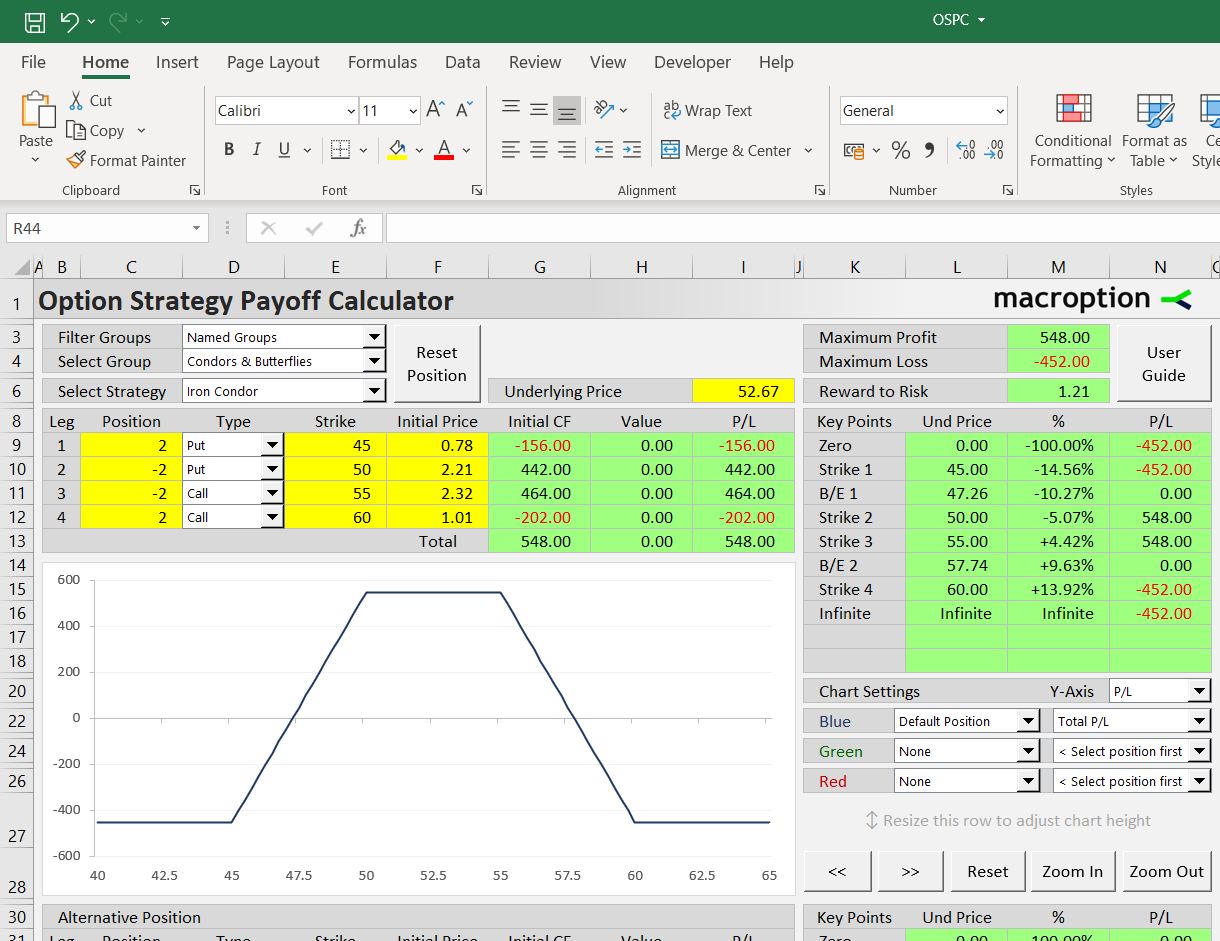
For example, at the lowest strike 45 (cell L10), which is -14.56% down (M10) from the current underlying price (I6), this iron condor will lose -$452 (N10).
Iron condors typically have two break-even points, one between the two put strikes and another between the two call strikes. In our example, they are at 47.26 and 57.74 (cells L11, L14). In cells M11, M14 you can see how far the break-evens are from the current underlying price – an important piece of information for evaluating an iron condor's risk and probability of success. In cells N11, N14 you can verify that the P/L at these prices is indeed zero.
In the top right corner, cells M3, M4 show maximum profit and maximum loss.
Cell M6 calculates the risk-reward ratio, shown as reward divided by risk, or profit potential per one dollar of risk (so higher is better).
In our example maximum possible profit is $548, maximum loss $452, and risk-reward ratio is 548/452 = 1.21.
The interpretation: In the best case scenario (when underlying price ends up between the middle strikes at expiration) you make $1.21 for every $1 you lose in the worst case scenario (when underlying price ends up below the lowest strike or above the highest strike).
Payoff Diagrams
It is often easier to understand the risk profile when viewed on the payoff diagram, which is shown in the chart in the middle of the sheet.
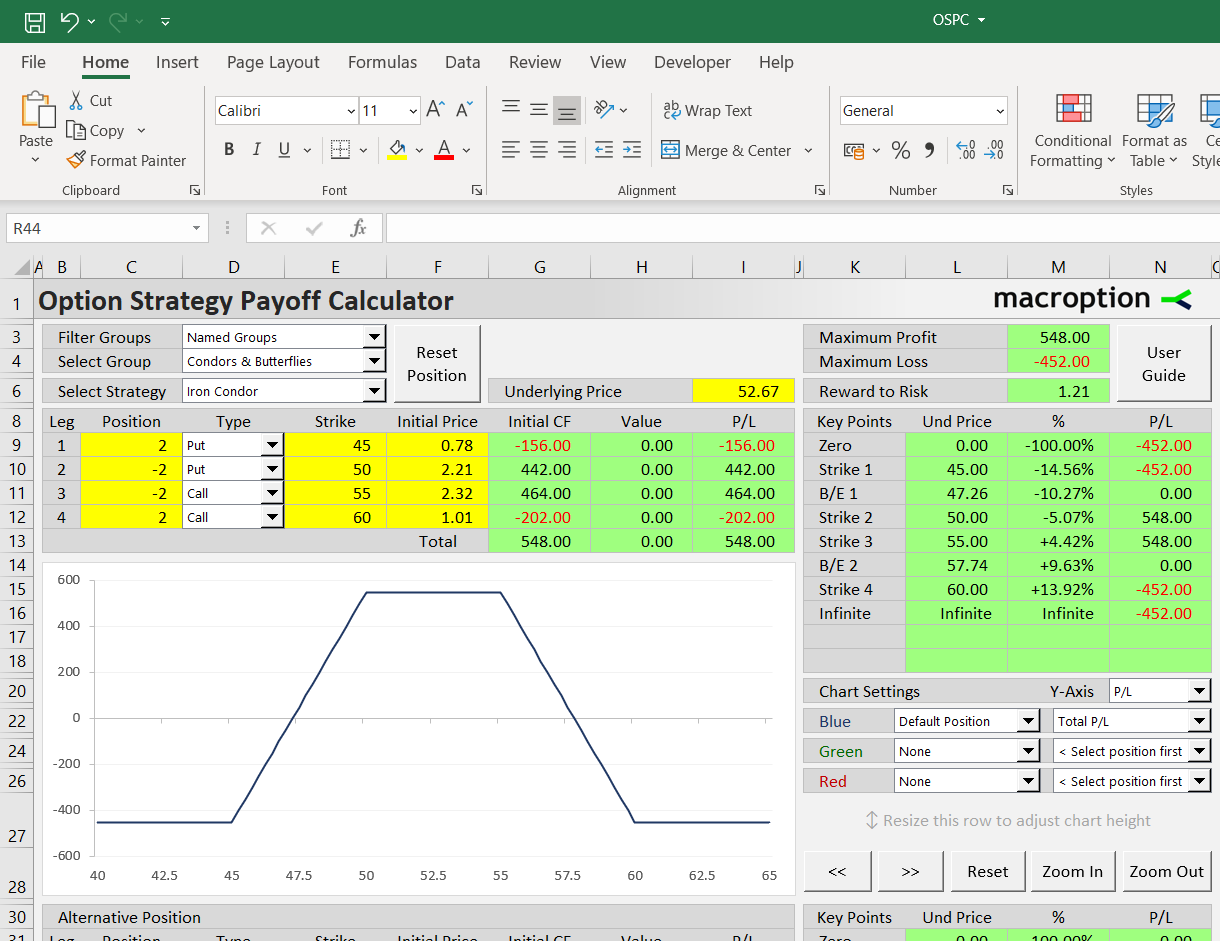
The chart can display the total iron condor position and/or the individual legs. For instance, it can show how a particular leg contributes to total P/L. You can select individual series in the dropdown boxes in cells K22-N26.
In the dropdown box in cell N20 you can choose whether the chart should display payoff at expiration without considering initial cash-flow ("Value") or profit or loss as payoff including initial cash flow ("P/L").
Comparing Two Condors with Different Strikes
Besides modeling a single position, you can use the calculator to compare two positions and draw both in one chart. For instance, you can compare two iron condors with different strikes, or compare an iron condor to a completely different option strategy.
The second ("alternative") position is set below the chart in rows 32-35, in the same way as the first ("default") position: you need to set the position size, instrument type (call/put/underlying/none), strike, and initial price for each leg.
For easier setup, you can use the buttons below in rows 38-40 to copy one position to another or switch them (default becomes alternative and vice versa). For example, when comparing an iron condor to its variation with different strikes, it is best to click the button "Copy Def > Alt", which will copy the default position inputs from cells C9-F12 to the alternative position inputs in cells C32-F35 and only change the strikes and initial prices for the alternative legs that differ (of course, you can also set up all the alternative position inputs from scratch).
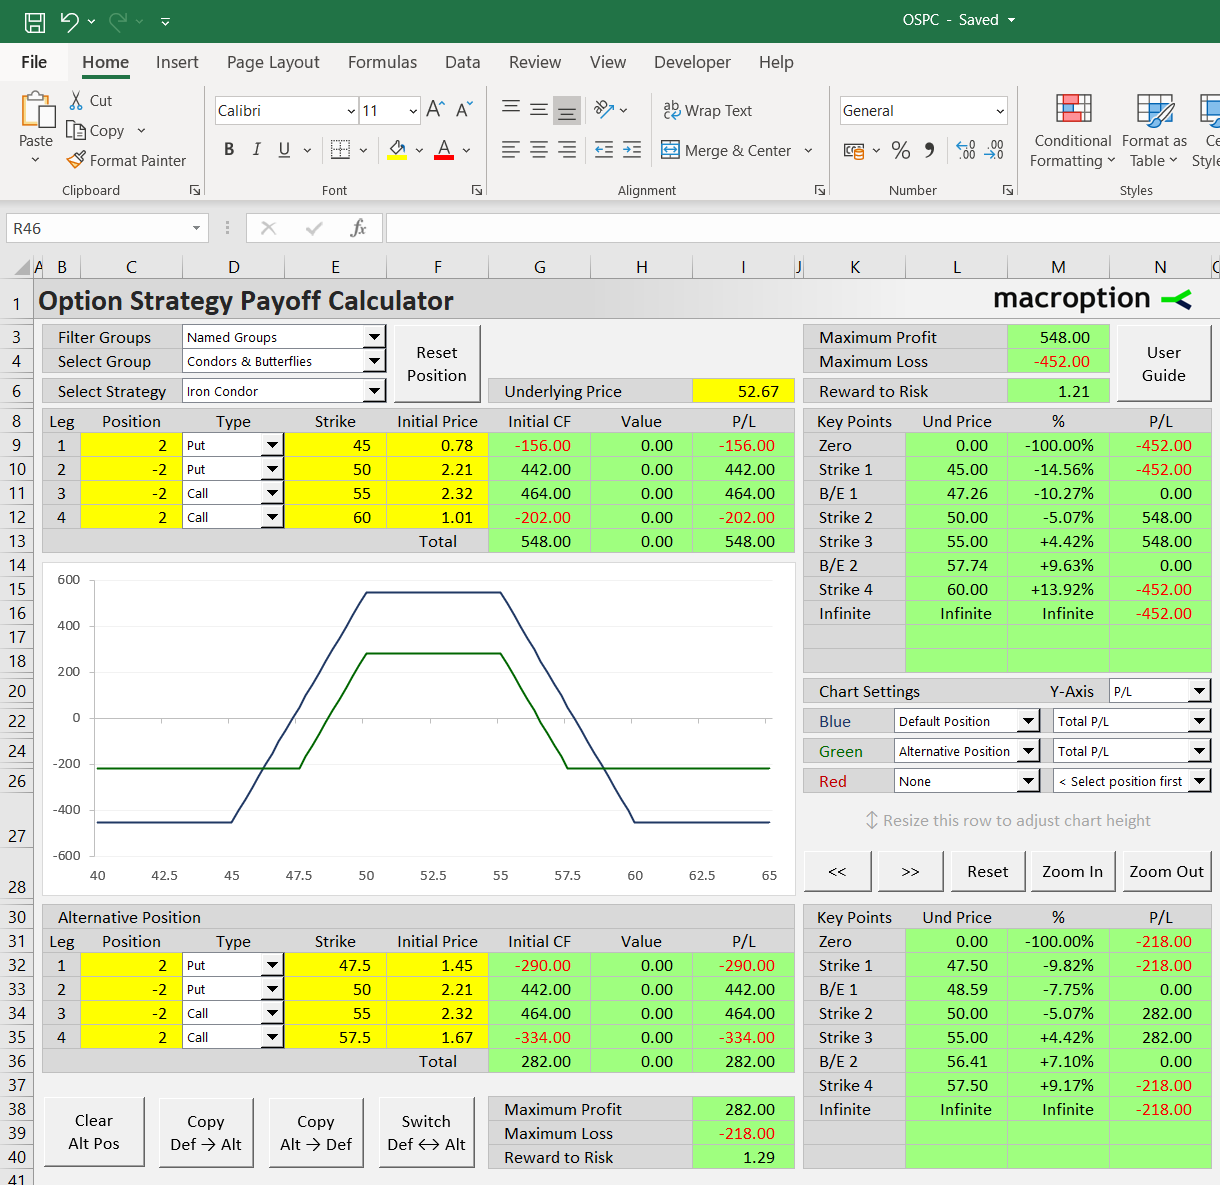
To display both positions in the chart, select them in the chart series settings in the dropdown boxes in K22-N26. In the screenshot above, the blue line (L22) is set to "Default Position" and the green line (L24) to "Alternative Position". It compares our original 45-50-55-60 iron condor with another with narrower strike gaps in both wings (47.5-50-55-57.5).
In the bottom right corner you can see the overview of P/L at all strikes and break-even points for the alternative position, as well as maximum profit, maximum risk, and risk-reward ratio. The formats are the same as for the default position. In this particular example, choosing the 47.5/57.5 strikes for the long options instead of 45/60 reduces both maximum profit and maximum loss, makes the profit window (distance between break-evens) narrower, but also slightly improves the risk-reward ratio.
Broken Wing Iron Condors
A popular variation of the iron condor strategy is the so called broken wing condor. Its main idea is to adjust the otherwise neutral directional exposure to a directional opinion a trader may have. This is done by choosing different strike distances in the downside (put) and upside (call) part of the condor.
For example, if we fear the underlying price may fall a lot, but think an upside breakout is very unlikely, we can move part or all of our risk from the downside to the upside by choosing different strikes. Instead of our original 45-50-55-60 strikes (where the distances between the two put strikes 45-50 and the two call strikes 55-60 were both $5) we use 47.5-50-55-62.5 (now the distance between the puts is only $2.50, but the distance between the calls is $7.50).
This completely changes the position's risk profile and directional exposure, as you can model in the calculator and compare it to the original position.
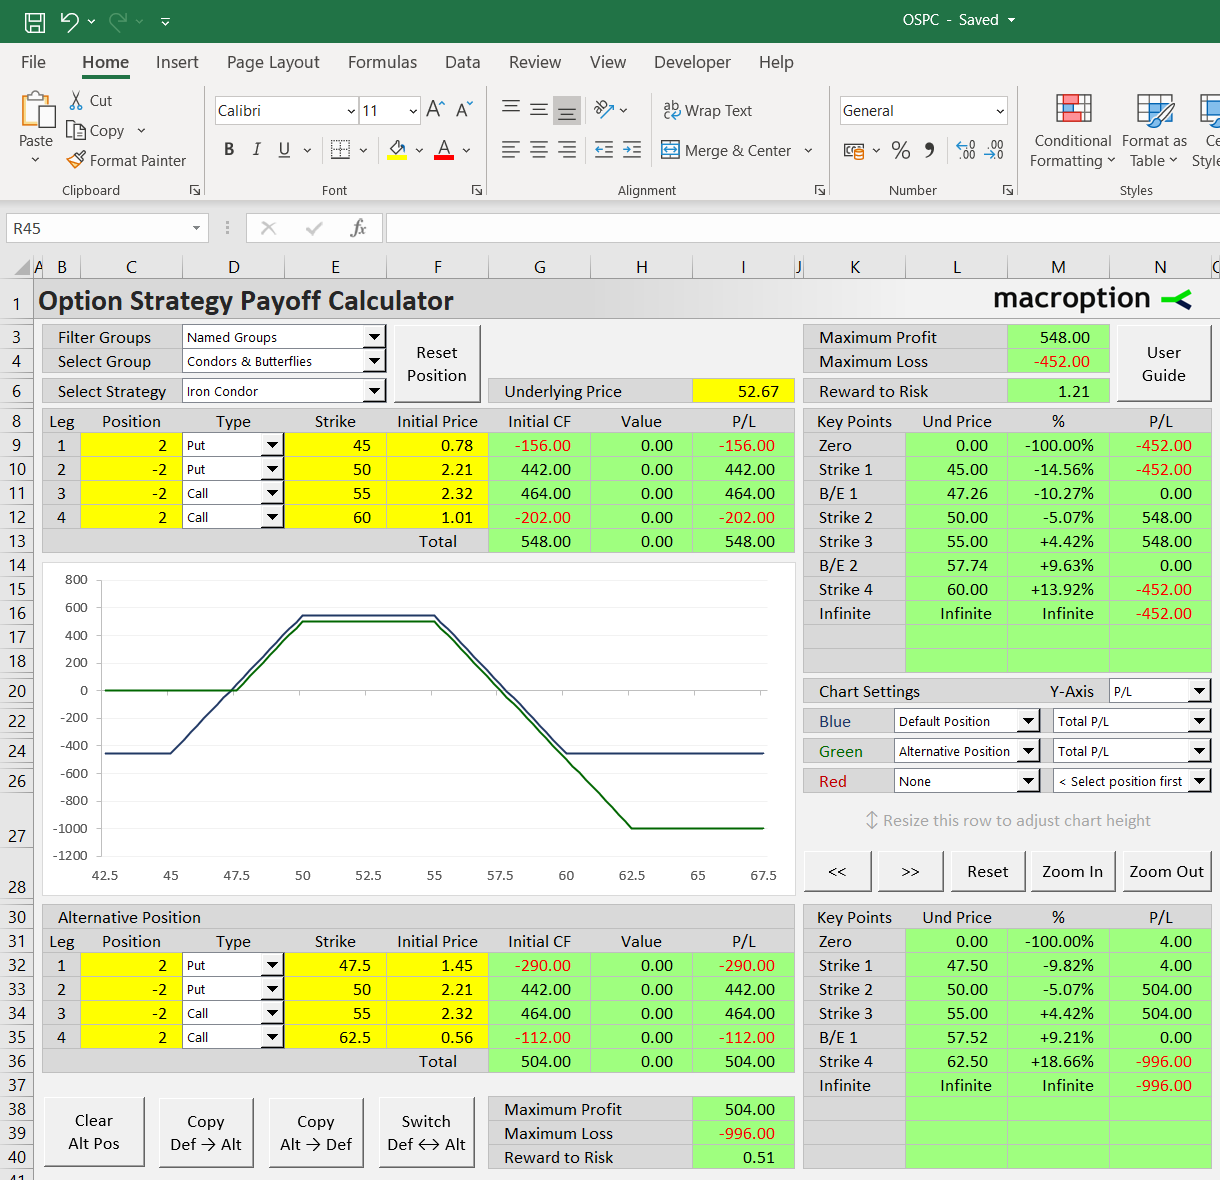
We can see that the broken wing condor does not lose money even when underlying price falls to zero. The tradeoff is the increased loss if underlying price jumps further to the upside, because now our losses keep growing up to the 62.5 strike. The risk-reward ratio looks much worse than for the original position (only 0.51 vs. 1.21), but now the risk only applies on one side (up).
Whenever we make changes to a position, some parts of our risk profile become more favorable, while others get worse. There are always tradeoffs. The calculator helps quantify all the changes and consider all of them when making decisions.
Comparing an Iron Condor to Another Strategy
In the same way as shown above, you can compare iron condors or broken wing condors to any other option strategies, such as butterflies, straddles, vertical spreads, or completely custom positions.