This page demonstrates how to set up and work with a long straddles in the Option Strategy Payoff Calculator.
Position Setup
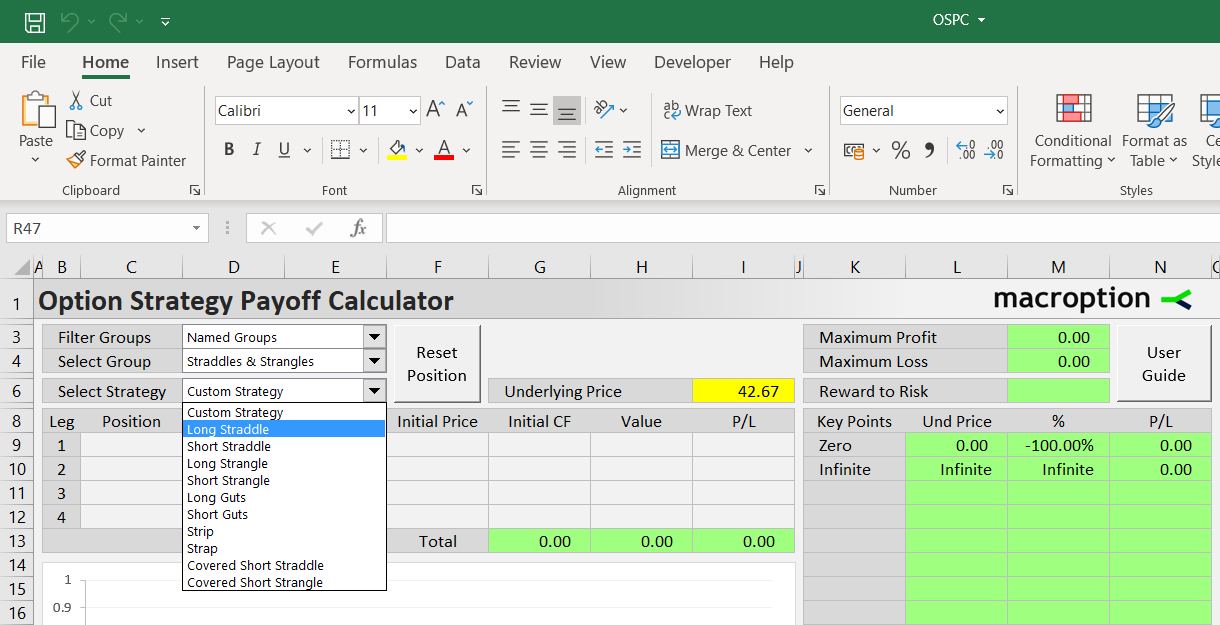
The fastest way to create a long straddle position is by selecting it in the dropdown box in cell E6.
Where to Find Long Straddle
You can find it via any of the following paths in the dropdown boxes in E3 (filter type), E4 (strategy group), and E6 (strategy):
- All Strategies (E3) / All Groups (E4) / Long Straddle (E6)
- Named Groups/ Straddles & Strangles / Long Straddle
- Number of Legs / Two Legs / Long Straddle
- Direction & Volatility / Long Volatility / Long Straddle
- Risk Profile / Limited Risk & Unlimited Profit / Long Straddle
The selection loads a predefined long straddle position with sample strike. Then you can change the strike, position size, and initial cost in the yellow cells C9-F12 (you can also set all these inputs manually without selecting the predefined strategy).
Example
Long straddle includes long positions in two options, one call and one put, with the same strike, expiration, and underlying, and same number of contracts. For example:
- Long 2 contracts of 45-strike put option, bought for $2.85 per share.
- Long 2 contracts of 45-strike call option, bought for $2.88 per share.
Let's create this position in the calculator.
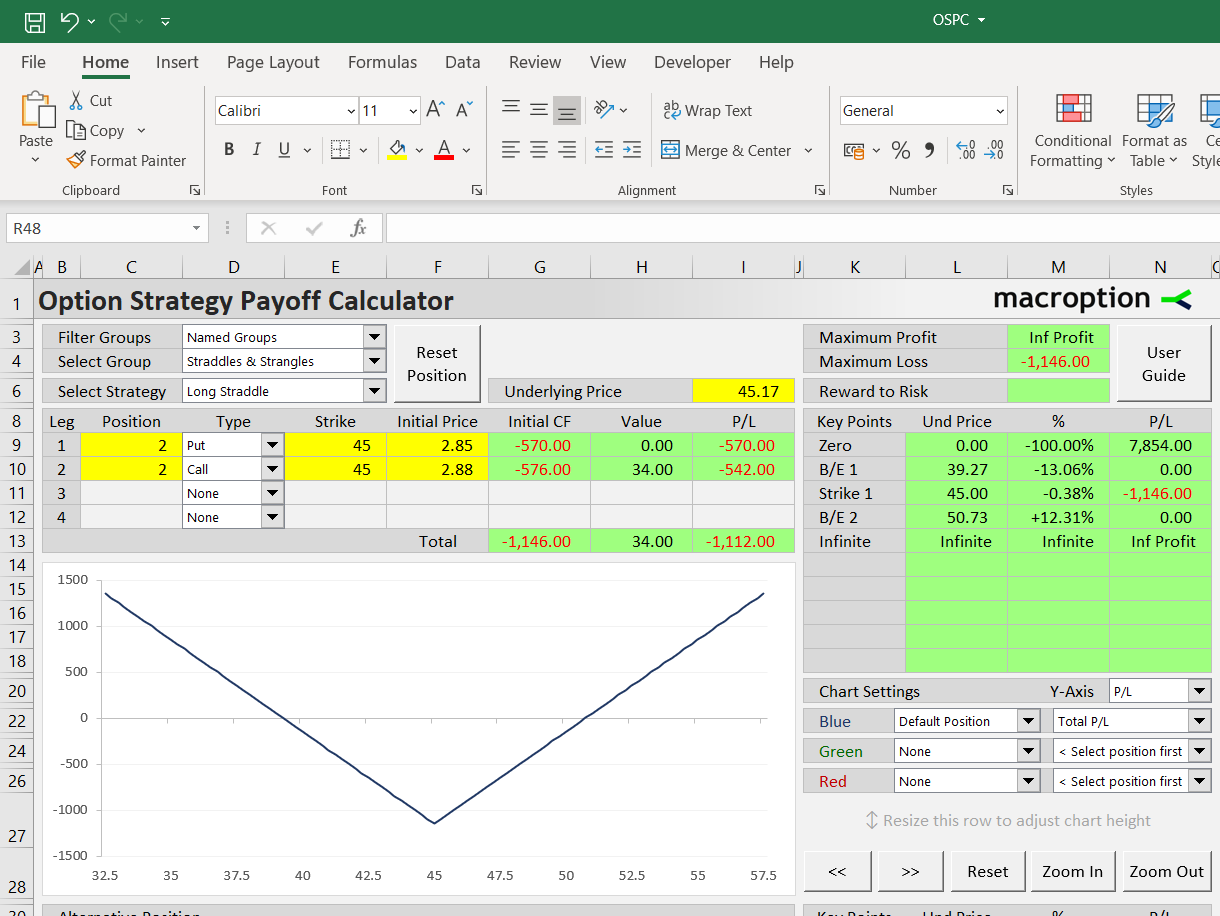
Start with instrument types in column D. Set leg 1 instrument type (the dropdown box in D9) to Put and leg 2 (D10) to Call. The other legs (D11, D12) are None, as long straddle uses only two legs. If you have selected Long Straddle from the dropdown box in E6, the instrument types are set automatically.
Because we are long 2 contracts of each, change the position sizes in cells C9, C10 to +2.
Column E is for strikes. Cells E9 and E10 should be 45.
In column F, enter the initial price paid for each option. It should be per share, with positive sign. Cell F9 is 2.85 (the price paid for the puts); cell F10 is 2.88 (the calls).
Column G calculates initial cash flow, based on initial price in column F and position size in column C. In our example cell G9 should be -570 (we paid 2.85 x 2 contracts x 100 shares = $570 for buying the puts) and cell G10 should be -576 (2.88 x 2 x 100).
By default, the calculator assumes 100 shares per option contract as for US stock options. If you work with different options, you can change contract size in the Preferences sheet (the OptContractSize setting).
Columns H and I show the position's value and profit or loss at a given underlying price, which is set in the yellow cell I6. Individual leg P/L is shown in cells I9-I12; total position's P/L is in cell I13.
Risk Profile and Break-Even Points
A more complete overview is available in columns K-N.
Cells K8-N18 show P/L at important price points, including the strike, zero, infinite, and the break-even points.
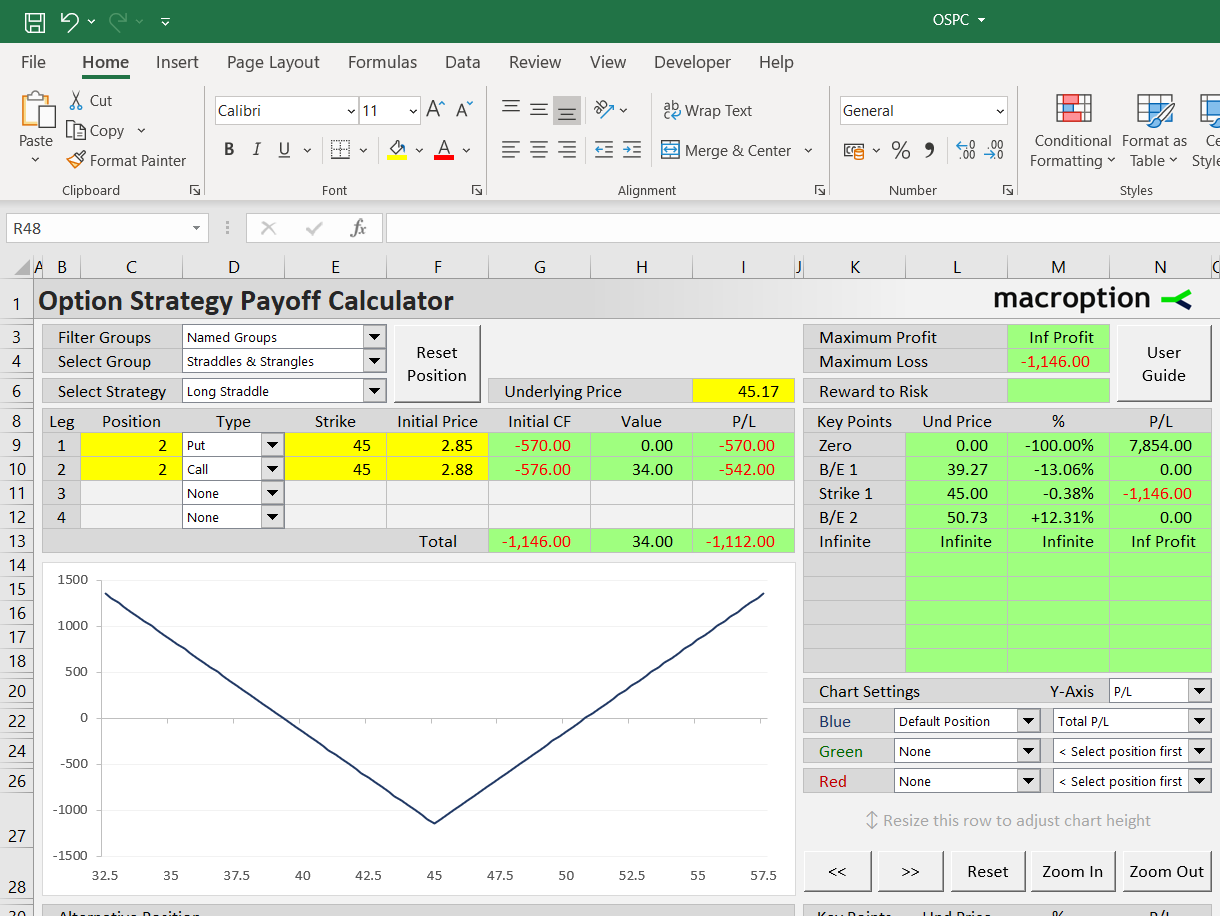
Long straddle has two break-evens, one below the strike and the other above. In our example, the break-evens are $39.27 and $50.73 (cells L10, L12), which is -13.06% and +12.31% (cells M10, M12) from the current underlying price set in cell I6.
Above in cells M3, M4 you can see maximum profit, which is infinite for long straddles, and maximum loss, which equals the initial cash flow and occurs only when the underlying price equals the strike at expiration.
Cell M6 normally calculates the risk-reward ratio for strategies with limited profit and limited loss; for long straddles it does not apply due to the unlimited profit.
Payoff Diagrams
In the chart you can display the payoff diagram for the entire straddle, as well as individual legs.
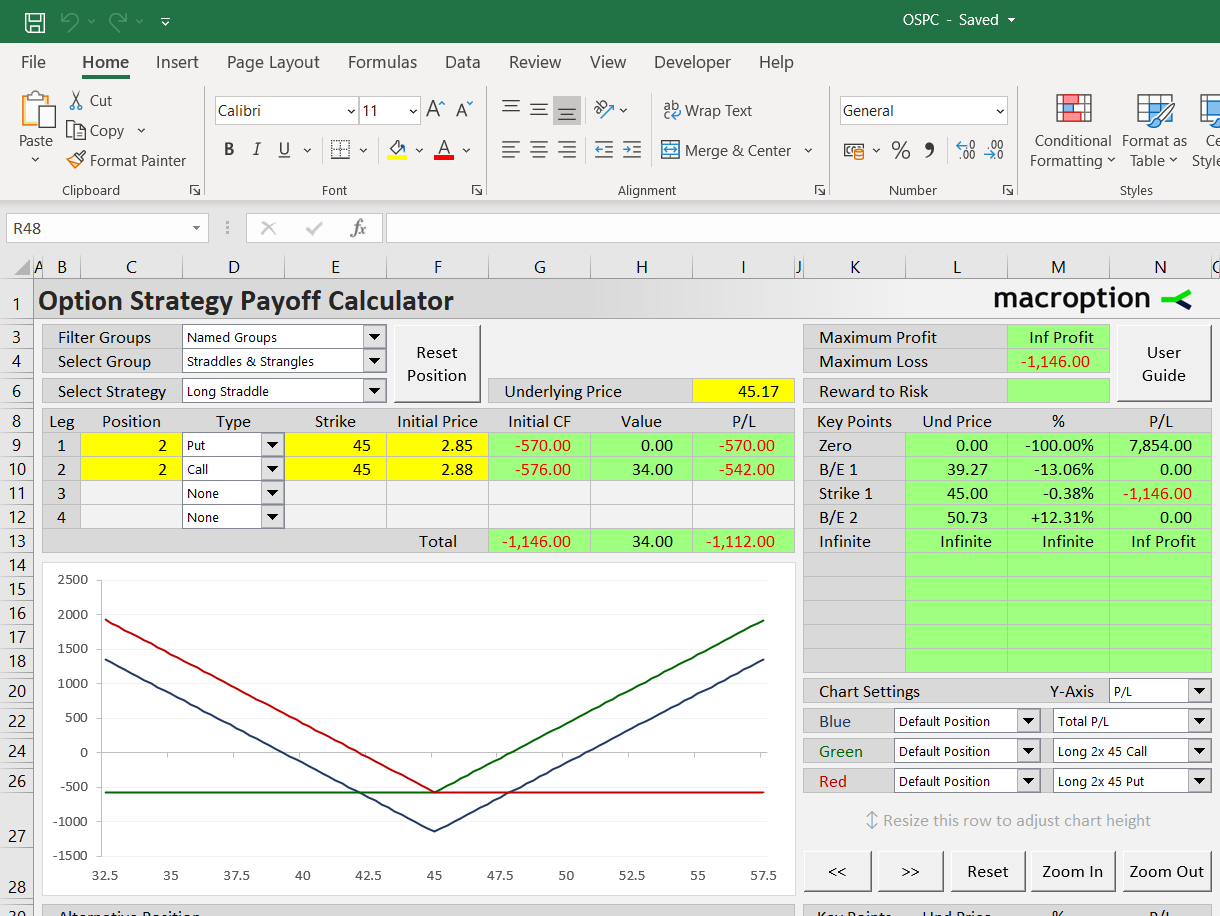
Individual chart series are set in the dropdown boxes in cells K22-N26. In the dropdown in cell N20, you can select whether to show the payoff without initial cost ("Value") or profit or loss including initial cost ("P/L"). You can also adjust the chart scale using the in row 28.
Comparing Long Straddle to Other Strategies
The calculator can model two positions at the same time, allowing you to compare the straddle to similar positions, for instance to long strangle (different strikes for the calls and puts), strip or strap (different position sizes for the calls and puts), or a completely custom position.
The second ("alternative") position is set up below the chart in rows 32-35 in the same way as the default position. You can use the buttons at the bottom for faster setup – for instance, copy the default position to the alternative position and then adjust the strikes and initial prices.
The screenshot below shows how to compare a long straddle with a long strangle position. To display both positions in the chart, select "Alternative Position" for the green line (the dropdown box in L24).
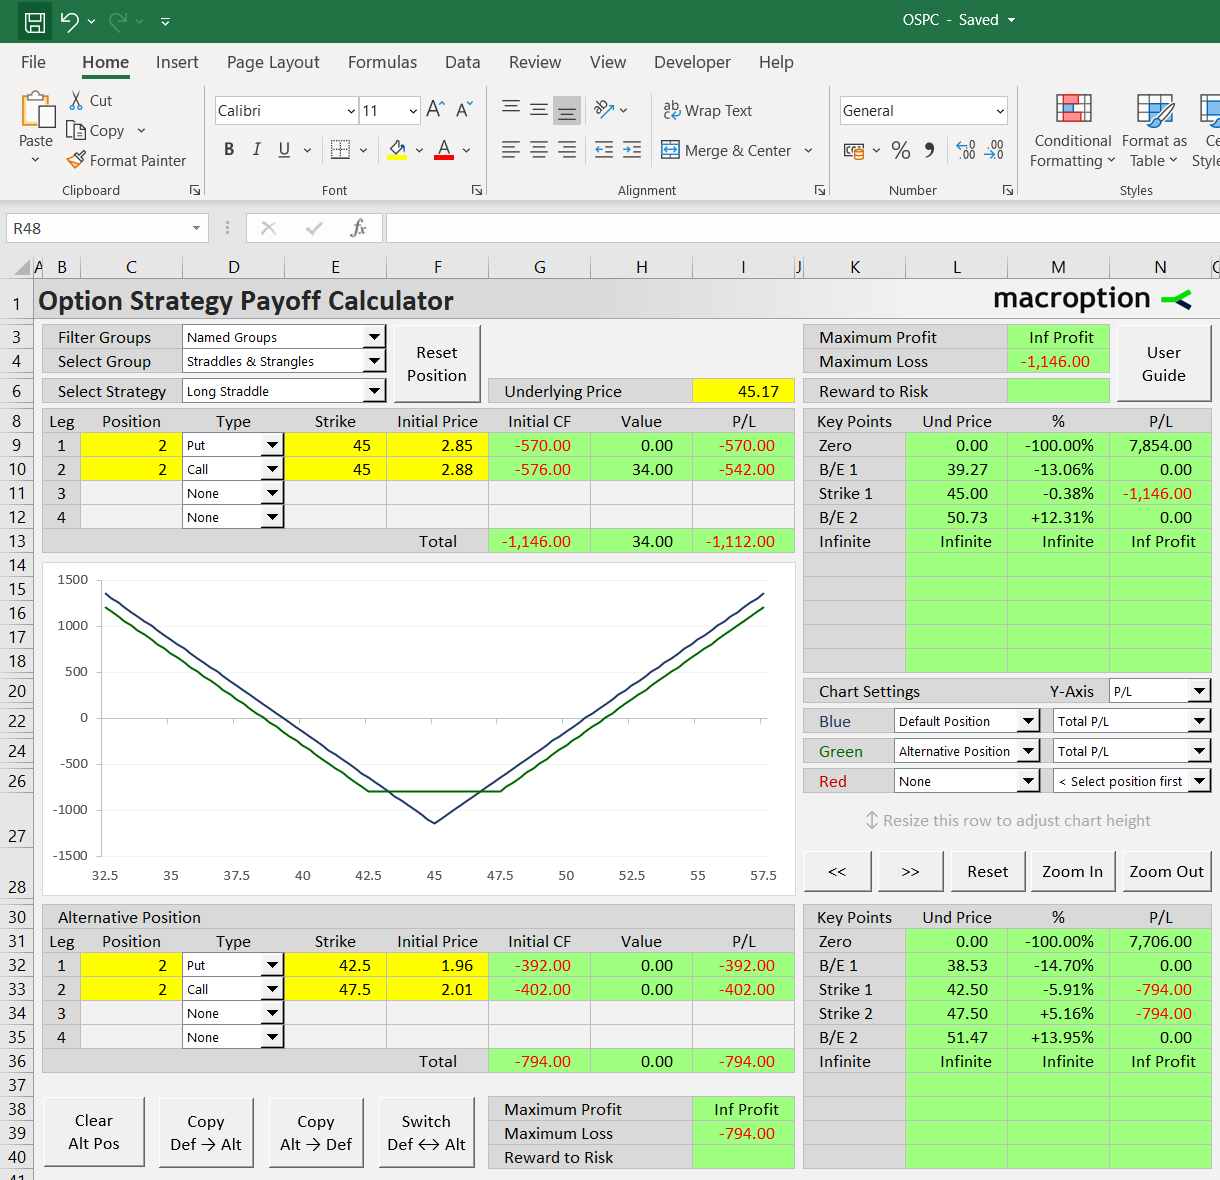
Main advantage of long strangle over long straddle is lower initial cost and maximum loss; the disadvantage is that maximum loss occurs everywhere between the strikes and also the distance between break-even points is usually wider. The calculator can quantify these differences and allow you to make an informed decision. You can see the alternative position's P/L at different price levels in the area K30-N40, including the two break-even points.