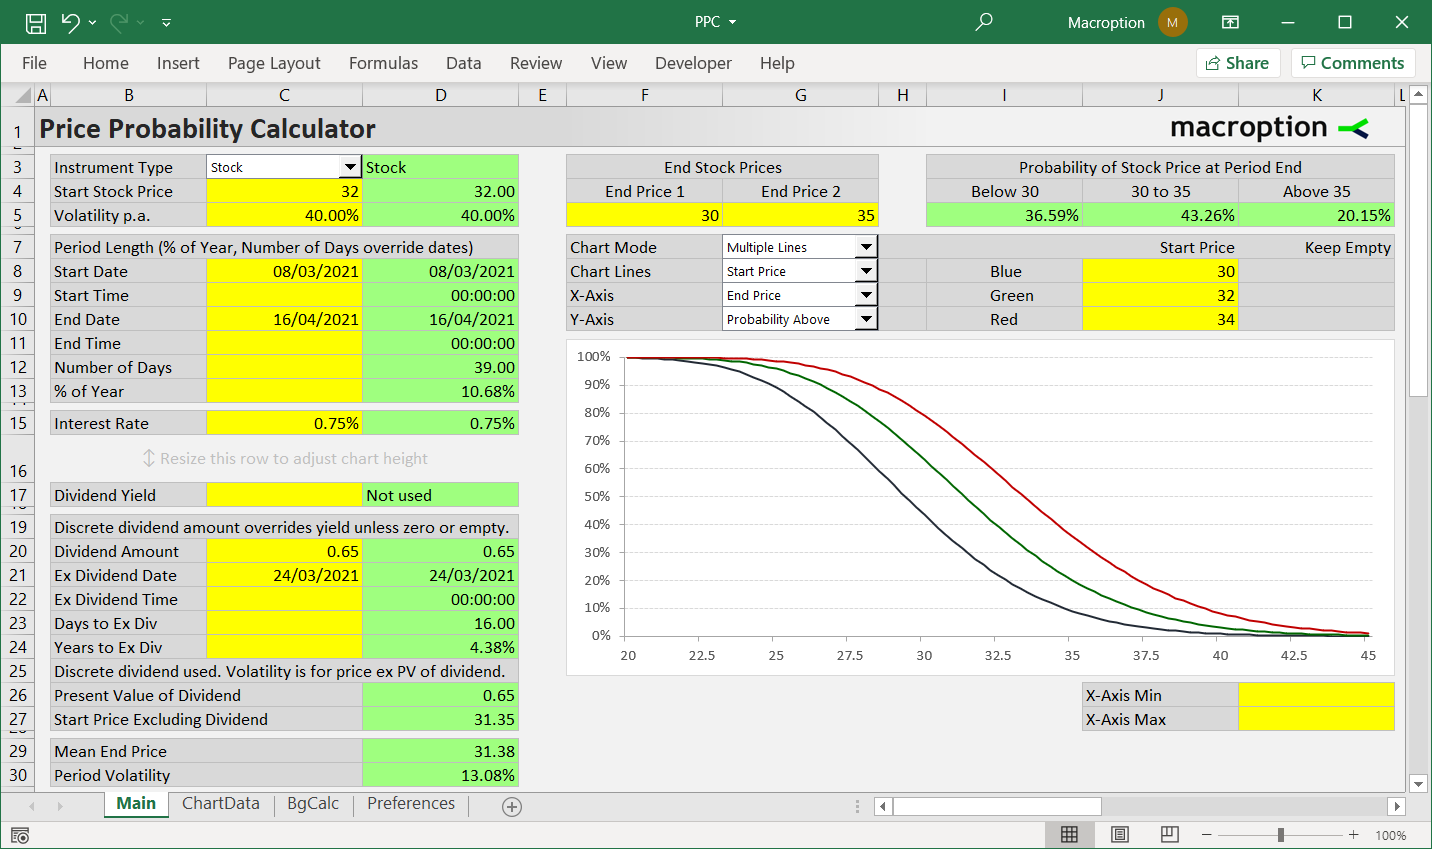
This calculator calculates the probability that an asset's price will be above a given level at a given point in the future, based on the asset's current price and volatility.
For example, if current stock price is 50 and volatility 20%, it answers this kind of questions:
What is the probability that the stock will be above 60 / below 45 / between 55 and 60, two months from now?
Chart shows how the probabilities change with different inputs, such as start price, volatility, interest rate, or period length.

It can work with stocks, indexes, currencies, or futures.
It supports both continuous and discrete dividends.
It works in all versions of Excel, Excel for Mac, and most other spreadsheet software, including Google Sheets, Open Office, or Libre Office.
$49 one-time payment
Instant download
All formulas are unprotected, open to view and edit. The calculation of probabilities is explained here.
For more details see the user guide or contact me.