Skewness Excel Calculator
Here you can download an Excel spreadsheet that calculates skewness, kurtosis, standard deviation, and other summary statistics for a data set you enter. Simply copy-paste your data (order doesn't matter) into the column marked in the file, choose population or sample, and see the result:
Download Descriptive Statistics Calculator.
Screenshots

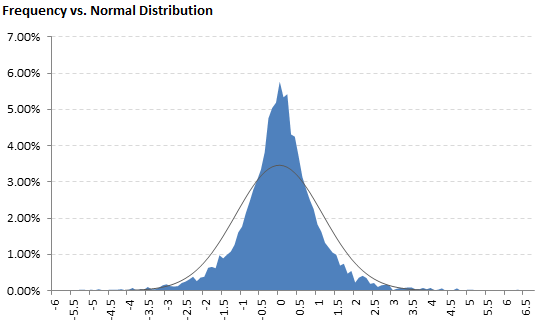
The calculator also contains several charts where you can evaluate skewness and the other measures visually and you can compare your data to normal distribution (which has zero skewness).


Calculating Skewness in Excel
In Excel, there is a built-in function for skewness: SKEW. This function calculates sample skewness. Unlike with variance (VAR.S and VAR.P) or standard deviation (STDEV.S and STDEV.P), Excel doesn't have any built-in function for population skewness. It is still quite easy to calculate population skewness in Excel if you know how to do it. You can either calculate it by adjusting sample skewness (the result of SKEW function), or manually using the formula below. Here you can see more details about calculating skewness in Excel.
How to Calculate Skewness Manually
Calculating Population Skewness

Calculating Sample Skewness

Detailed explanation and derivation of the formulas is available here: Skewness Formula.
Download the Skewness Calculator
Here you can download the Excel calculator for skewness, kurtosis, and the other summary statistics.